
Timeline
Nov. 1, 2026, midnight UTC
March 31, 2027, midnight UTC
Data
The data for this competition (56.6 GB) is hosted at the open data repository Zenodo:
Contents
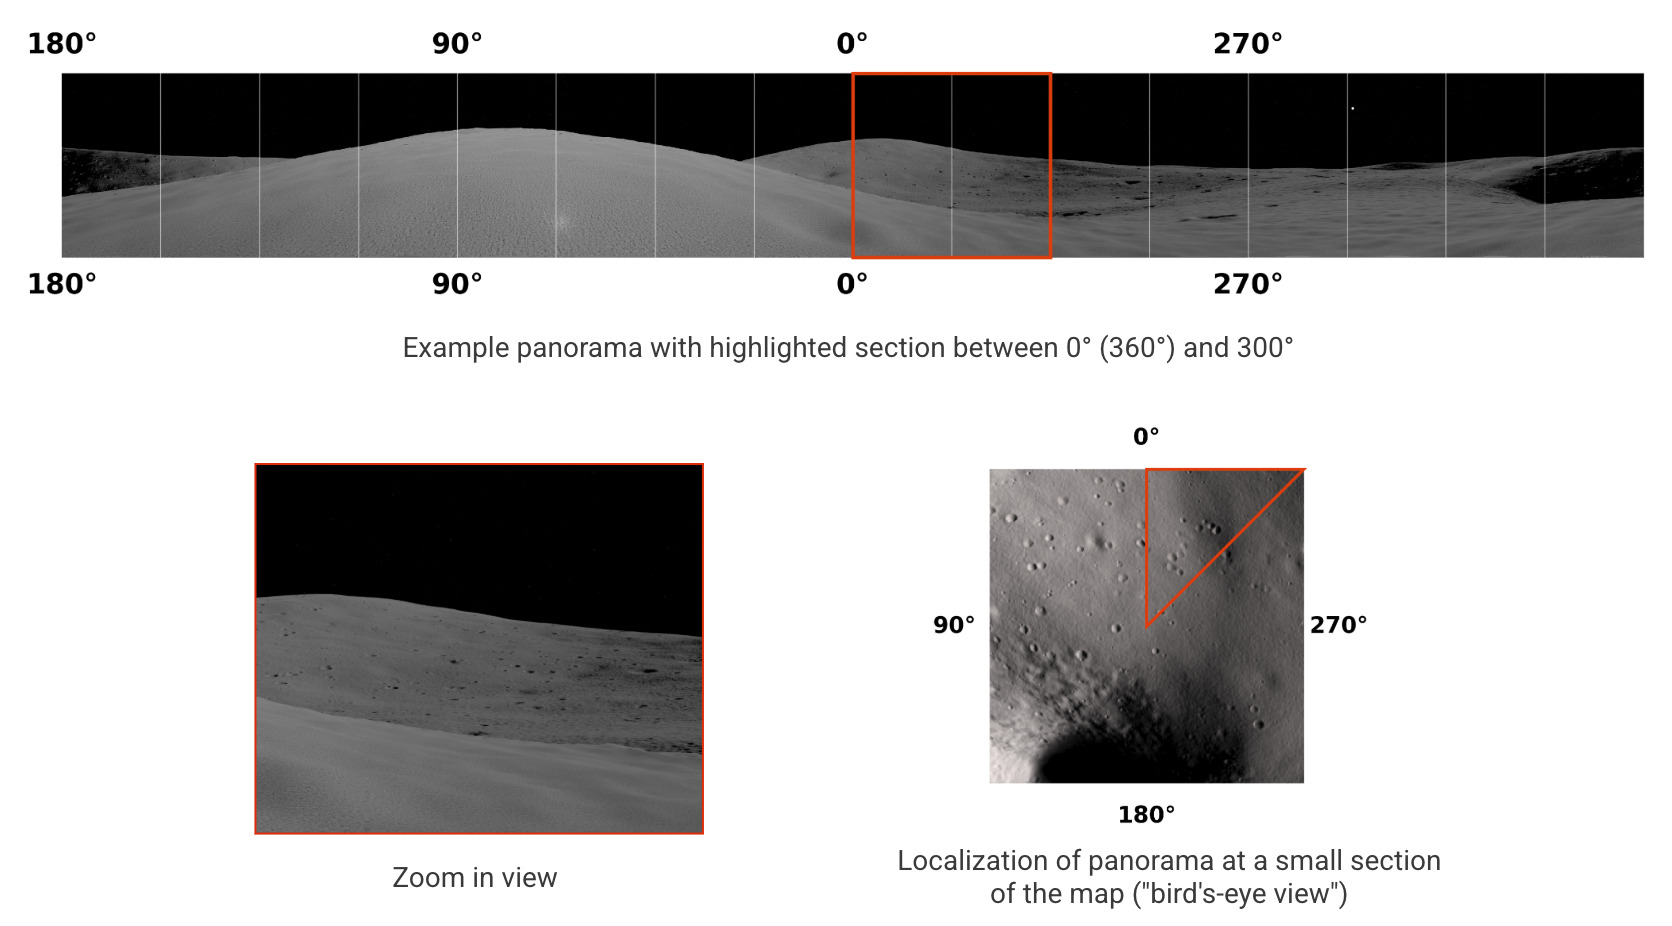
The competition dataset contains synthetically rendered images of two distinct lunar regions generated by PANGU, an established software for producing realistic planetary science images. Each region comes with a large set of panoramic 360° views, taken from various locations. The viewpoint of the camera for a panorama is always exactly 2.5m above ground with zero pitch and zero roll. The orientation of each panoroma is such that the horizontal center line corresponds to the North direction (0°). The local time at which the panoramas are rendered varies, providing different sun azimuth and sun elevation angles.
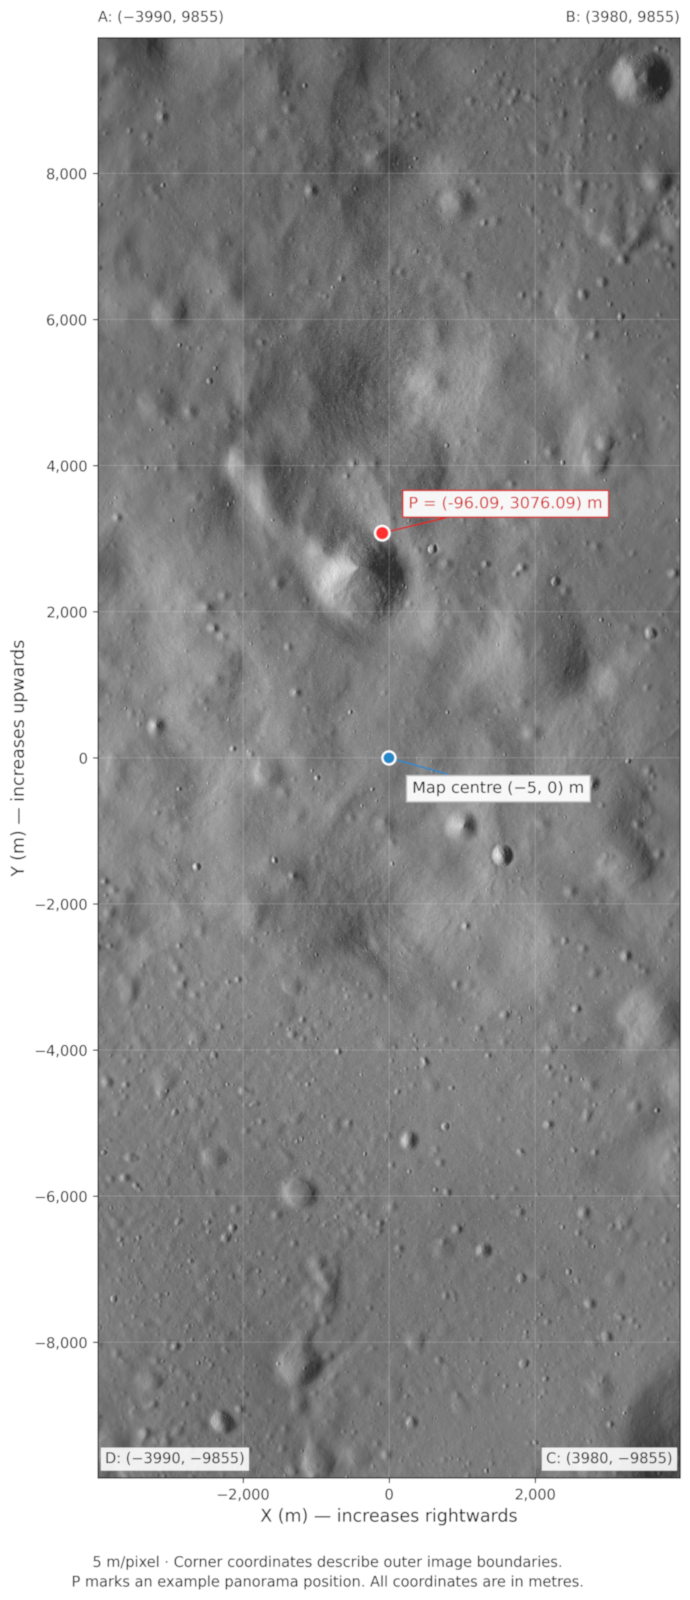
The motivation behind the Lunar X-view challenge is to develop a method to localize the panoramas within a provided map that is robust enough to handle inconsistent illumination conditions and relies on pixels only. Consequently, local time and digital elevation maps (DEM) are not available. Thus, the only information for each panorama are the pixel values, which are encoded as 8-bit grayscale .png images. The maps on which the panoramas need to be located are provided as 8-bit grayscale .png as well, from a viewpoint looking straight down towards the surface. The illumination conditions for those maps are always a sun azimuth of 90° and a sun elevation of 20° and the ground-resolution is 5m per pixel.
The first region "train" can be used as reference for developing cross-view localization approaches. A full set of labels (x,y coordinates within the map-coordinate system) are provided.
The second region "test" comes without any labels. The tasks of this competition is to localize the remaining panoramas of test and submit their coordinates to Kelvins.
The zip file contains the dataset organized as follows:
train/map/: contains map of train region in png format and metadata in json formatpanoramas/: train panoramas of 10808 different viewpoints in png format, 6965 x 706, 8bit grayscale eachlabels.csv:positions of each train panorama viewpoint in the corresponding metric coordinate system
test/map/: contains map of test region in png format and metadata in json formatpanoramas/: test panoramas of 10000 different viewpoints in png format, 6965 x 706, 8bit grayscale each
For an explanation on the metric coordinate system, refer to Submission Rules.
Preview
Here is an example from the "train" region, highlighting the conventions with regards to orientation.
Getting started
We will provide all teams with a starter kit that will aid with tasks such as
- loading the data
- visualization
- preparing submissions